【one】
Recently, private equity tycoon Liang Hong was scolded on the hot search because the net value of the funds he managed fell sharply.
Not long ago, Dan Bin cleared, built, and cleared his positions again, and his “timing ability” made investors look disgusted.
At this time last year, Qiu Guolu was ridiculed to stop investing and should concentrate on “wiping the trophy”, of course, because of his performance.
The public offering of top star fund managers is also unfavorable. In the fund bar, there are endless scoldings and complaints against Xie Zhiyu, Fu Pengbo, and Zhu Shaoxing…
We can’t help but ask, how did the once famous, excellent and even outstanding fund managers, even “Gods”, become worse in a year and a half, or even become “garbage” in the eyes of Christian Democrats?
Was the “good fund” we chose at that time wrong?
In all honesty, the top-performing funds are indeed good funds, while the under-performing funds are indeed “bad funds”!
Should we go the other way and praise the laggards and criticize the fund managers who have performed well?
It is undeniable that a fund with good performance is of course a good fund, but when we find a fund “good”, if we do not hold it, its “good” in the past has nothing to do with us.
What we hope is good must be the “good” after holding it, that is, the “good” in the future. Only by doing well in the future can we make money.
Therefore, to evaluate whether a fund is good or not, it is useless in the past, and it is really good in the future.
So, how can a fund be “good” in the future?
The good future may have the following situations:
1. The strong stay strong. The current outstanding performance is a good fund.
2. The feng shui turns, and it will come to my house next year. The current performance laggard is a good fund.
3. There is no obvious rule. It doesn’t matter whether the current performance is good or bad, whoever likes it is who.
【two】
Which situation is more realistic? This requires careful empirical research.
In mid-September 2021, I ranked the top ten active equity funds in the top 10%, 50% position, 90% position and the bottom every year since 2012. The ten active equity funds have been held and held since 2012. The returns of the two scenarios of changing funds every year are back-tested; and compared with the stock-biased hybrid fund index representing the average level of active-biased hybrid funds and the passive stock-based fund index representing the average level of index funds.
At the same time, a back-test has been done on the return of each of the top ten index funds ranking the top and bottom every year since 2012.
The original data comes from the self-defined ranking of Tiantian Fund. The sample selection method is: 1) Select the top and bottom ten funds from the participating funds; 2) Calculate the 10%, 50% and 50% funds from the number of participating funds. 90% starting position, ten funds are selected from this position in sequence; 3) Funds with stock holdings less than 50% are excluded, and QDII funds are excluded; 4) Funds managed by the same fund manager are included in every ten selected funds. Can only appear once; 5) Funds tracking the same index can only appear once in every ten selected funds.
I reorganized the data of the backtest at that time and divided it into the following situations.
The first is to replace new funds to buy according to the ranking of the previous year.
The backtest results are shown in the table below.
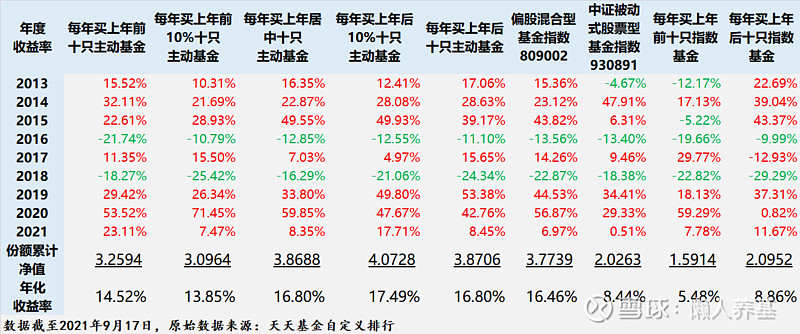
1. The back-test data shows that the purchase of new funds is replaced according to the ranking of the previous year, and generally follows the rule that the cumulative return of the ten active funds with the lowest performance of the previous year is higher, which means that the active funds with the lowest performance of the previous year are more profitable. good fund .
The specific order is as follows: the bottom 10% (4.0728) > the bottom ten (3.8706) > the middle (3.8688) > the top ten (3.2594) > the top 10% (3.0964). Every year, the annualized return of ten active equity-biased funds that ranked in the bottom 10% of the previous year was 17.49%, which was more than 3 percentage points higher than the annualized return of 13.85% of the bottom ten funds that bought the top 10%. This difference is almost pure debt. The annualized return of the fund.
2. From the point of view of a single annual return index, the ten active funds after purchase were leading in 2013, 2017 and 2019, the ten active funds with 10% after purchase were leading in 2015, and the ten active funds in the middle of buying were leading in 2018. The Top 10 Active Funds to Buy lead in 2016 and 2020, while the Top 10 Active Funds to Buy lead in 2014 and 2021. The ratio of the rear, middle and front leading years is 4:1:4.
In the bottom index of active fund annual returns, the top ten buys accounted for 2 years, respectively, in 2015 and 2016; the top 10% of the ten funds for buy accounted for 5 years, respectively, 2013, 2014, 2018, 2019 and 2021 ; The post-purchase ten and the post-10% each account for one year, 2017 and 2020, respectively. The ratio of the top ten and top ten active funds to the bottom of the year is 7:2, that is to say, 78% of the top ten active funds are at the bottom of the annual performance .
3. The latter ten and the last 10% have a certain relative advantage over the middle ten active funds, but the advantage is not significant; the top ten and top 10% active funds are bought, and the latter ten and the bottom 10% are active funds. Fund, performance returns surpassed each other in 9 statistical years, and the gap was not obvious .
4. The cumulative returns of the ten active funds in the middle are basically the same as the stock-biased hybrid fund index, which represents the average return level of active-biased funds; the cumulative returns of the top ten and top 10% of the ten active funds are significantly lower than those of the stock-biased hybrid fund index. Stock hybrid funds; the cumulative return of the ten active funds after purchase is better than the partial stock hybrid fund index.
5. The cumulative return of buying the ten index funds after the previous year is substantially better than buying the top ten index funds of the previous year every year .
The cumulative return of the ten index funds after buying each year is significantly better than that of the CSI passive equity fund index, while the cumulative return of the top ten index funds purchased is significantly lower than that of the CSI passive equity fund index.
In terms of years, the returns of buying the bottom ten index funds of the previous year exceeded that of the top ten index funds of the previous year in seven of the nine statistical years, accounting for more than 77.78% of the year.
6. The cumulative returns of all active fund backtesting groups beat the index fund backtesting group and the CSI passive stock fund index , indicating that active funds are a better fund category.
Second, every year after buying each ranked fund group of the previous year, it has been held unchanged.
The backtest results are shown in the table below.
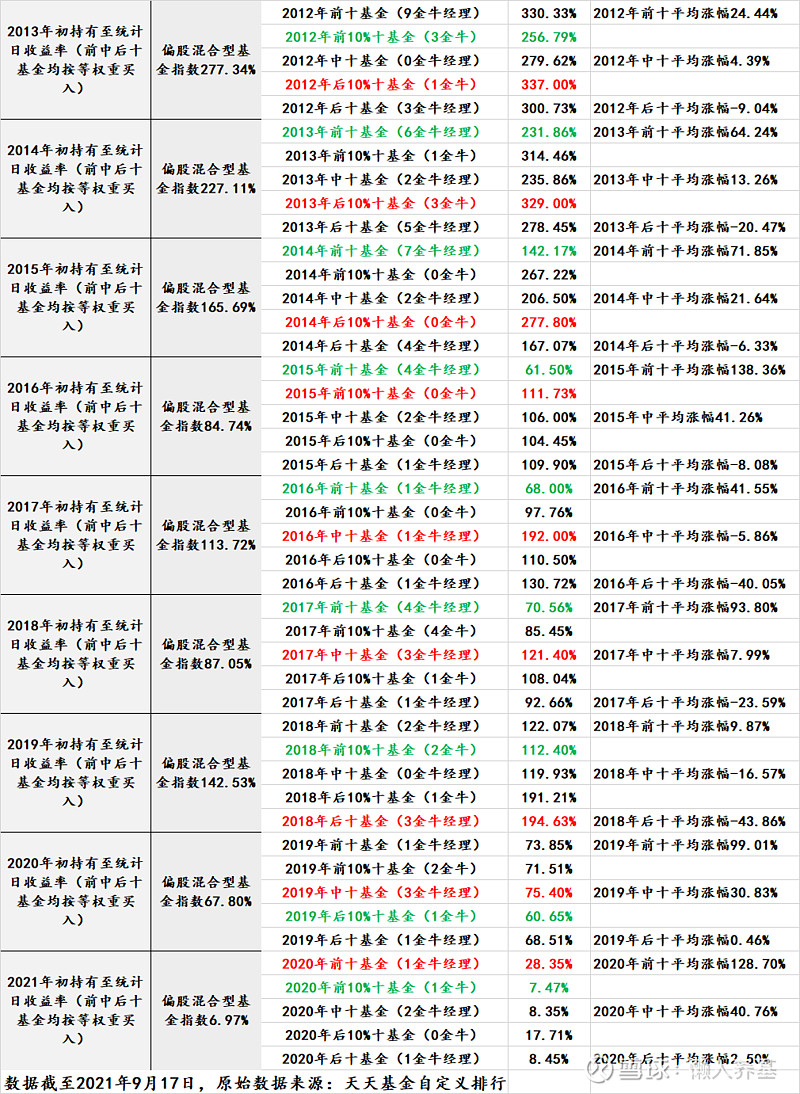
1. Perform a simple arithmetic average of all the annual cumulative returns of each group, and basically follow the rule that the cumulative returns of ten active funds with lower performance in the previous year are higher , which is only one place from the ranking of buying new funds every year Different, that is, the average cumulative return of the ten funds after buying and holding is higher than that of the ten funds after buying . (130.33%)> middle (127.84%)> top ten (124.60%)> top 10% (111.62%) .
It is clear that the funds (portfolios) that underperformed in the previous year were better than the funds (portfolios) that performed better in the previous year.
2. From the perspective of a single statistical year, in the nine statistical years, the cumulative returns of the ten active funds with 10% after buying and holding have 3 annual leading positions, the last 11 annual leading positions, the middle 3 annual leading positions, and the top ten and 10 annual leading positions. The top 10% each have a lead in one statistical year, and the total proportion of the latter, middle and former leading statistical years is 4:3:2.
Simply add the top 10 and the top 10%, and the bottom 10 and the bottom 10% respectively, and you can also compare the return characteristics of the top and bottom: only buy and hold the previous year’s performance in the two statistical years of 2020 and 2021 The top-performing fund portfolios have the leading cumulative returns; the other seven statistical years are all buy-and-hold fund portfolios with low performance in the previous year.
Among the bottom statistical annual indicators, the top ten buy-hold funds accounted for 5 seats, the top 10% buy-hold funds accounted for three seats, and the bottom 10% buy-hold funds accounted for one seat. That is to say, in all 9 statistical years, the ten funds that bought and held the top ten and top 10% were at the bottom of the eight years, and the proportion of the bottom year was close to 90%.
3. The ten active funds in the bottom ten and bottom 10% of buy-and-hold still have certain advantages over the ten active funds in the middle of buy-and-hold, but the latter still have bright spots: In the nine statistical years, buy-and-hold The top ten active funds in the previous year led three years, but never had the bottom performance in a year.
This shows that it is not necessary to deliberately pursue the indicators of lagging performance in the previous year , as long as you do not chase up and buy funds that performed too top-notch in the previous year.
The third is a hypothetical situation where we can buy the current year’s ranking fund group in advance and hold it all the time.
Earlier, we analyzed the top, middle, and bottom performance rankings together, and came to the conclusion that the top, middle, and bottom performance rankings before buying correspond exactly to the poor, middle, and low performance returns after buying. it is good.
Based on intuition and common sense, buying a fund with top performance is a kind of chasing behavior, which leads to a higher cost of holding positions, while buying a fund with a lower performance is a bargaining intervention, and the cost of opening a position is lower . It makes sense to prove that it is better to intervene on dips than chasing up, and this explanation is also logical.
Specific to the special “commodity” of active stock-biased funds, why can’t their fund managers eliminate the phenomenon of late performance through active management of the funds that ranked top in the previous year’s performance? After all, in each year, you buy various funds with different performances in the previous year, and they all have the same starting point of time for their “competition”.
What would happen if the buying time for them was advanced by one year, that is, at the beginning of the year when the performance ranking was determined to be high and low? Although it cannot be done in practice, because at the beginning of the year, it is impossible to predict who will be in the top and who will be in the bottom. However, we make such an assumption in theory and perform performance retrospection, which is helpful for us to make further analysis.
The retrospective results are shown in the table below.
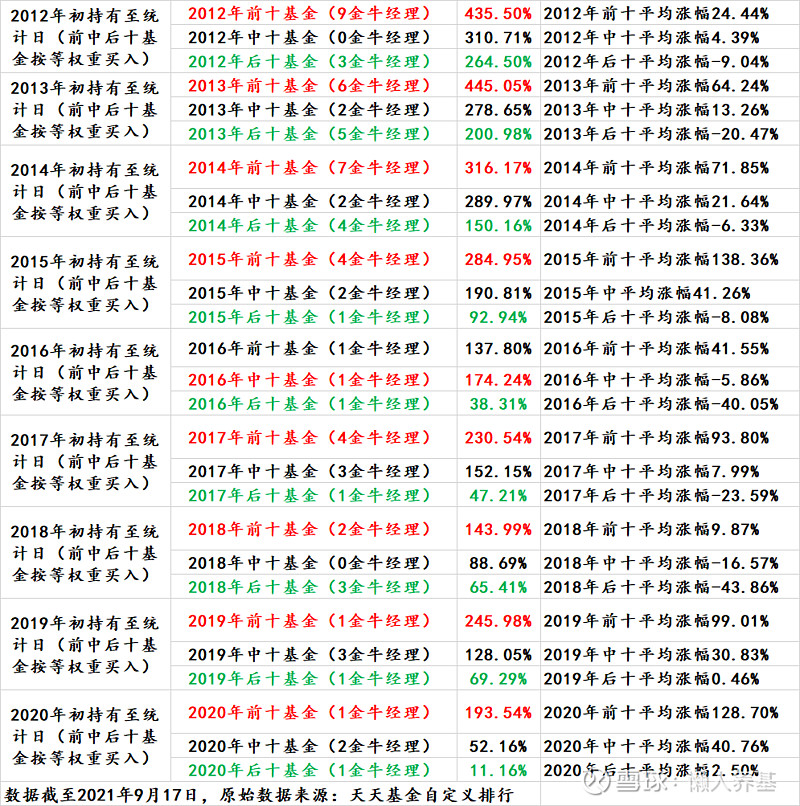
The results show that the top ten active fund portfolios beat the middle and bottom ten active fund portfolios.
Why are the statistical results so different after only one year difference?
The performance returns of the top ten and bottom ten active funds differed by more than 80% in most years, and most of the years one was positive and the other was negative. The result calculated by compound interest, of course, brought a huge gap in performance returns.
Analyzing the deep-seated reasons, the competence circle of each active fund manager is relatively stable, and the industries or stocks (pools) that he or she is most familiar with and researched in depth are basically relatively fixed, and most of them No industry or style rotation capabilities. The performance ranked the highest in the year, mainly because the fund position and the market style of the year were very close, so it also greatly overdrafted the performance of the next few years; and the performance was lower, mainly because the fund position and the market style of the year were extremely different. In the next few years, the market style is likely to be favorable to them, and the market will compensate them to a certain extent for their extremely backward performance in the current year.
【three】
in conclusion:
1. There is a clear cyclical nature of fund performance. Whether index funds or active funds, rising too well or falling too much will likely go negative in the not too distant future.
There is no such thing as a “good fund” whose performance is consistently good and whose performance will not deteriorate.
2. The return of buying a “good fund” for a long-term holding is actually not as good as buying a “bad fund” and holding it for a long time.
Of course, this is from the perspective of a portfolio of 10 funds, and any single fund cannot guarantee to follow this rule.
3. We think a fund with good past performance (top-notch) is a good fund, and buy it, there is an implicit assumption in the subconscious that we can get the good return of the fund in the past, but in fact it is not.
The best returns of the fund in the past had nothing to do with us until we bought it.
4. The cumulative return of buying 10 active stock-biased funds with eyes closed is significantly higher than that of the CSI passive stock fund index, and is also significantly better than that of the top ten or bottom ten index funds.
It shows that active funds are generally better than index funds and are a better type of fund.
5. One of the most important indicators of a good fund is: there must be a good price.
From this point of view, a fund that has good returns in the past and is currently in hot pursuit is not likely to be a good fund.
@Today’s topic #雪ball star plan public fundraising talent# @snowball creator center @ETF star push officer @snowball fund
All the opinions and funds involved in this article do not constitute investment advice, but are only a true record of my own thinking and practice. I invest in the market based on this, at my own risk.
This article was first published by Lazy People , and the copyright belongs to the author. Reproduction without permission is strictly prohibited. Friends are welcome to forward the circle of friends.
For more past articles, please click:
[Lazy Yangji Snowball Column Article Directory]
This topic has 6 discussions in Snowball, click to view.
Snowball is an investor’s social network, and smart investors are here.
Click to download Snowball mobile client http://xueqiu.com/xz ]]>
This article is reproduced from: http://xueqiu.com/2356382715/228346007
This site is for inclusion only, and the copyright belongs to the original author.