In the process of discussing ROE and sustainable high ROE and low debt ratio strategies, some friends mentioned or recommended several indexes one after another, such as dividend potential, dividend quality, consumption dividend, MSCI China A-share international quality, CSI Dongfanghong competitiveness, etc.
Thank you for your help in broadening your horizons. For the indices mentioned, we have briefly gone through the compilation rules and historical performance. Some of them performed well and caused some thinking.
Some of these indexes are only related to dividends. Previously, there were some small studies on dividends, which happened to be put together for comparison. The indexes involved are dividend potential, dividend quality, consumption dividends, CSI dividends, SZSE dividends , See if there are some breakthrough conclusions.
Regarding dividends, sort out some relevant understandings:
1. Net profit ≠ earning money: the current accounting system is based on accrual basis, and the net profit on the income statement does not mean that the company actually earns money. The fact that a company can distribute dividends implies that the company is profitable and has really made money. Only when the money is in the account can there be money to distribute dividends;
2. Cash dividends need to be taxed, and the specific tax rate is determined according to the holding time. If the shares are held for more than one year, the dividend tax will be exempted; if the shares are held from 1 month to one year, the dividend tax will be 10% of the dividend; if the shares are held for less than 1 month, the dividend tax will be 20% of the dividend.
3. Cash dividends are not extra money earned by investors. As a shareholder, there is no change in assets before and after dividends, which is equivalent to pocketing the left and right.
4. Cash dividends will be ex-dividend and ex-rights, the company’s net assets will be reduced, and the reduced part is the part of dividends.
5. After the cash dividend, the ex-dividend and ex-rights net assets will decrease, and the stock price will be lowered on the ex-dividend date. If the company can maintain its profitability, it will be a matter of time before the stock price rises back, that is, the process of filling the right.
6. The distribution of bonus shares does not involve changes in net assets. In the above-mentioned indexes with the word “bonus”, the dividends mentioned in the compilation rules should all be cash dividends (some index compilation rules are not expressly stated, but it can be found between the lines that it is cash dividends) )
It is a common phenomenon that A-share stocks do not pay dividends. It is not necessary to comment on whether they are good or bad. You can return to common sense and restore the real scene. For example, if you partner with someone to open a restaurant, after the money is invested, the possibility of share transfer is not high. The liquidity is very poor, and it is usually not easy to find a suitable person to take over. Therefore, after the money is invested, can it be returned? Fundamental and making money, the key is whether the company can make money and distribute dividends every year. If you don’t pay dividends, you want to reinvest, hope to get more dividends, and eventually return to dividends.
This is the logic of screening constituent stocks based on dividends. The index for screening sample stocks based on dividends aims to screen out companies that can make money and earn real money.
Index comparison
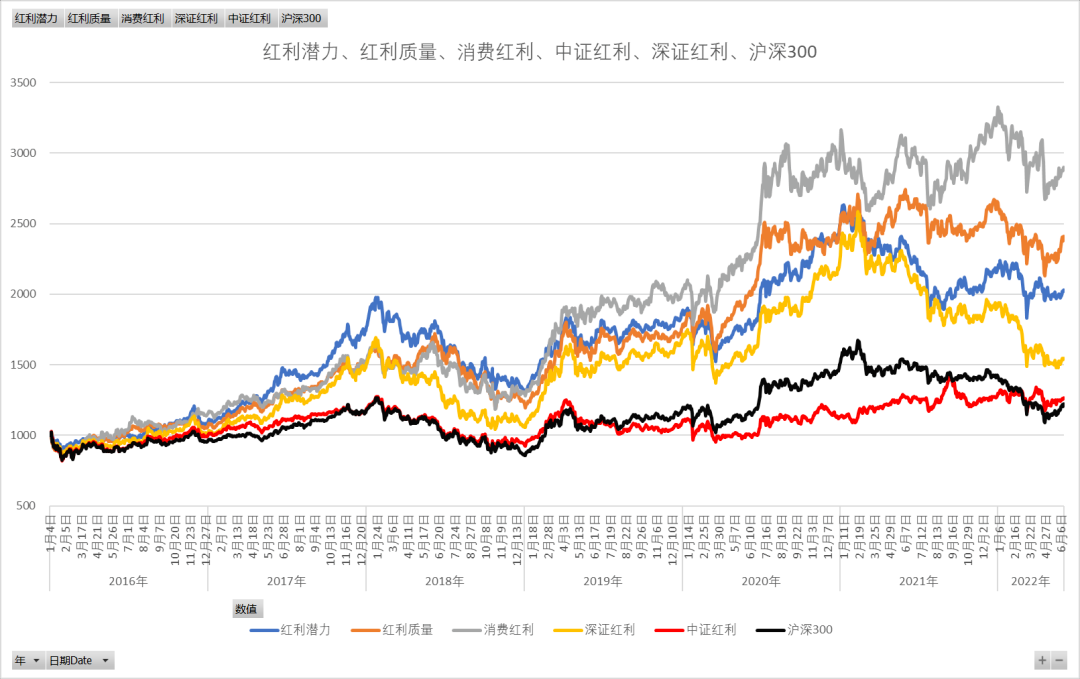
In the data provided by the official website of CSI, the displayed historical data is from January 4, 2016, and there is no more complete data for Lixin. ), after adding SZSE dividends, looking at the current income:
Consumption bonus > bonus quality > bonus potential > CSI bonus > CSI 300.
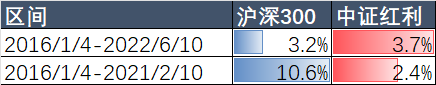
It should be noted that when making this comparison, it is not possible to directly judge the pros and cons based on the selected time period data, because this statistic has interval dependence.
For example, according to the data from January 4, 2016 to June 10, 2022, the annualized dividend of CSI is slightly larger than that of CSI 300 (3.7% VS 3.2%), but if statistics from January 4, 2016 to February 2021 On the 10th, the result became that the annualized dividend of the CSI was much smaller than that of the CSI 300 (2.4% VS 10.6%).
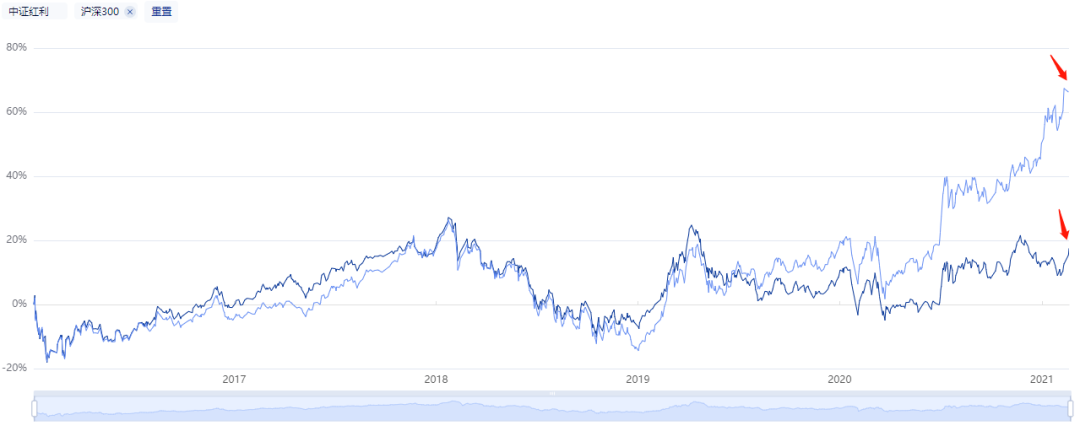
However, if the comparison time is long enough, one index obviously outperforms the other index most of the time, and after research, it is considered that it is the result of the effect of the factors we are concerned about, and it can be used as the basis for the judgment of superiority and inferiority. Although it does not mean that the future will be good, the support of historical data will give investors more confidence.
In the above comparison, within 6 and a half years, dividend potential, dividend quality and consumption dividends have significantly outperformed CSI Dividends and CSI 300, including SZSE Dividends. rules and factors.
Among the above indices, the real dividend index is CSI Dividend and Consumption Dividend. Consumption Dividend is the industry subdivision of CSI Dividend. The samples selected by major consumer industries are essentially the same. The logic is that the dividend yield ranking is sampled, and the dividend yield is weighted. There have been many studies on CSI dividends before, so I won’t repeat them.
For other indexes with the word “dividend”, the dividend or dividend rate is the stock selection rule, and the index calculation is weighted by the free float market value, that is, the logic of making money is who has the most weight and rises well, and contributes greatly to the index’s rise.
detailed analysis
SZSE dividends
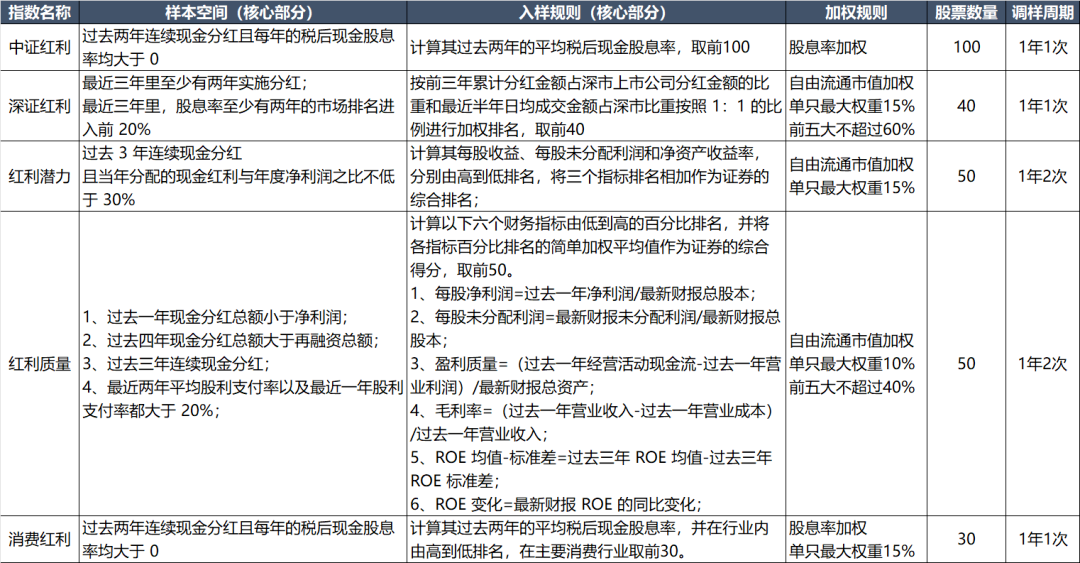
The sample entry rules are “weighted ranking based on the proportion of the accumulated dividends in the previous three years to the dividends of listed companies in Shenzhen and the proportion of the average daily transaction value in the Shenzhen market in the last six months in a weighted ranking of 1:1.” Good companies are usually relatively stable and stable . Rare , I think it is this rule that guarantees the stability of the best companies in the SZSE dividend. It is not based on the size of the dividend rate, but the amount of dividends and trading volume to ensure that those components with large dividends and good liquidity are Stocks remain in the index, rather than being sifted in and out by the more volatile dividend yields.
This is a different logic from the CSI dividend. The CSI dividend is similar to the dog stock theory. A high dividend rate generally means that there is an undervaluation, which is equivalent to buying undervalued and waiting for a return. The core logic is not to select good stocks, but to earn money from low to high dividend yields, which is essentially the same as when we use the PE reference to buy the index, buy undervalued stocks and sell overvalued stocks. Therefore, the sample rate of change of CSI Dividends is very high, and 20% replacement is limited in the compilation rules. As far as I understand, if there is no such limit, the replacement rate will be far more than 20%.
Potential for dividends : “Continuous cash dividends in the past three years and the ratio of cash dividends distributed in the current year to annual net profit is not less than 30%” as the sample space, and the sample entry rules are “earnings per share, undistributed profits per share and return on equity. , rank from high to low respectively, add the three index rankings as the comprehensive ranking of securities, and take the top 50.” It is emphasized that the dividend payout rate in the past three years is not less than 30%, and the ranking is based on three profitability-related indicators. The goal is to screen stocks that earn stable money and real money. It will be better than the China Securities Dividend and inferior to the Shenzhen Dividend, but the requirements for dividends, or the requirements for earning money and earning real money, are more stringent.
For this reason, the number of sample replacements/total number of samples each time is counted, the dividend potential and the CSI dividend are even more than 20%, and the upper limit of the adjustment ratio of these two is adjusted by 20%. In other words, the two are adjusted at the top every time. , if the ratio is not limited, it will be even higher. The average replacement rate of Shenzhen dividends is 12%, and the upper limit is 20%.
Dividend quality
There are more conditions for the quality of dividends. The sample space emphasizes continuous dividends, the dividend payout rate is not less than 20%, and the total cash dividends are less than the net profit. It also emphasizes that the dividends cannot be borrowed money.
There are more conditions for sample entry, please see:
Net profit per share = net profit in the past year / total share capital of the latest financial report, this is simple, the higher the higher the higher.
Undistributed profit per share = undistributed profit of the latest financial report / total share capital of the latest financial report, the accumulated net profit every year is put into the undistributed profit, and the higher the better.
Profit quality = (cash flow from operating activities in the past year – operating profit in the past year) / total assets in the latest financial report, here it should refer to the net cash flow from operating activities, this indicator is to exclude companies that make fake money or financial fraud, the reasons above As I said, the accounting system is based on accrual. Profits in the income statement do not mean real money. Here, we hope that companies that make real money will come in. The higher the value, the better.
Gross profit margin = (operating income in the past year – operating cost in the past year) / operating income in the past year, this is also simple, the higher the better.
ROE mean – standard deviation = ROE mean in the past three years – ROE standard deviation in the past three years. This indicator is actually comparing the lowest ROE value. The higher the lowest ROE value, the better the stock, but the lowest value of the stock ROE may be abnormal. Here The mean-variance method is more representative.
Change in ROE = the year-on-year change in ROE of the latest financial report. Compared with the year-on-year growth of the previous year, it is believed that the larger the year-on-year increase, the better.
Six good students are logically good, and have made a lot of restrictions, hoping to select high-quality companies. In my personal opinion, index investment seeks average returns, and I don’t like too complicated and many conditions. The more conditions there are, the more inclined they are to take the initiative, and they are all screened for this purpose, and they will not further analyze the selected ones and go directly to individual stocks?
The sample is adjusted once every six months, the sample adjustment rate is not limited, the replacement rate is relatively large, 50 samples, 30 replacements in the latest time, 60%, and 4 replacements with history, the average replacement rate is 54%.
In the previous analysis of sustainable ROE, I had a feeling that good companies are stable and rare, but the quality of dividends does not seem to think so.
consumption bonus
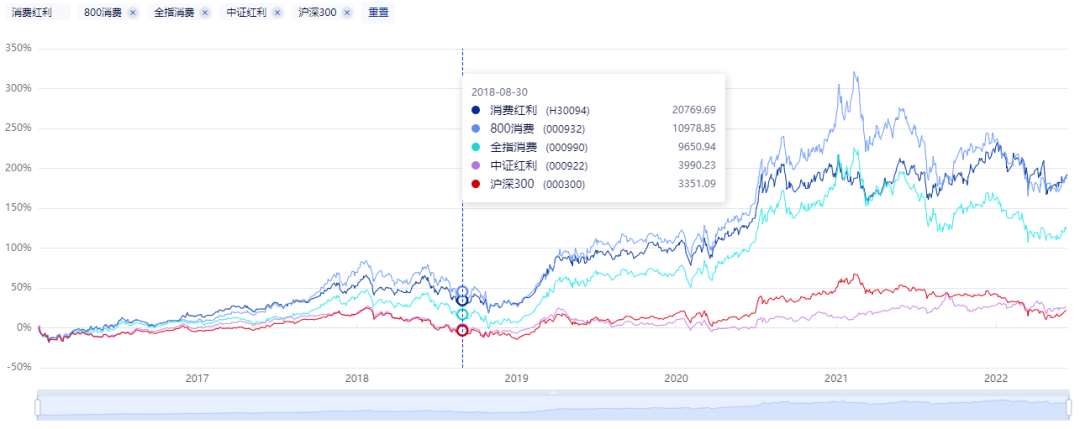
Consumer dividends are the best performers among the indexes compared above. Its rules are exactly the same as those of CSI Dividends, but the gap with CSI Dividends is so huge, which shows that the good returns of consumer dividends may not be the result of the effect of the dividend factor, but the good performance of the major consumer industries themselves.
Compared with CSI Consumption (800 consumption) and All Index consumption, they both far outperform CSI Dividend and CSI 300, of which Consumption Dividend is close to CSI Consumption.
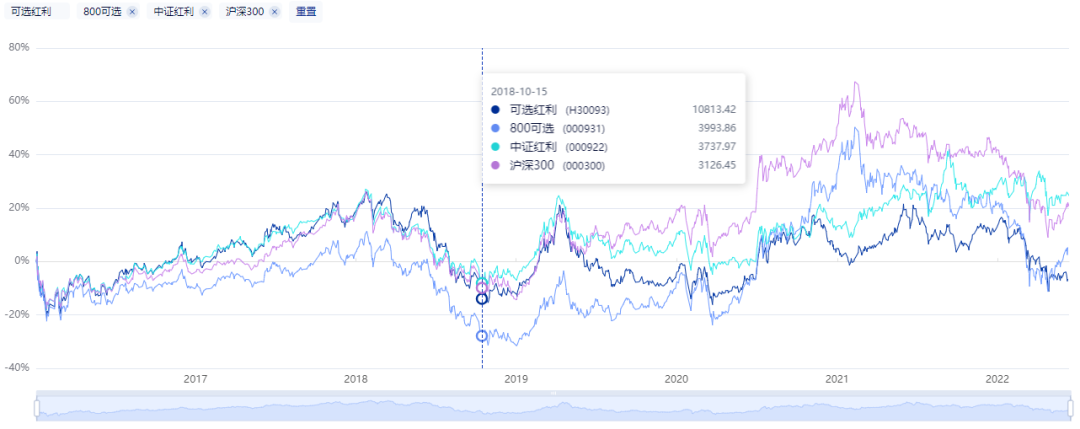
The same compilation rules have different results in terms of dividend options. They underperformed CSI Dividends and CSI 300. We went to see CSI options, and the performance was also not ideal.
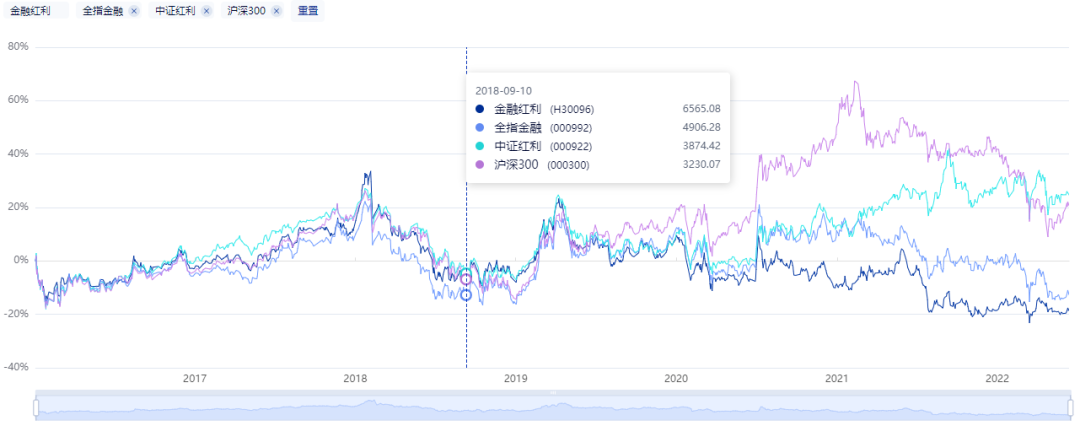
Another example is the financial dividend, which is a dividend index of different industries. The compilation rules are the same. It also underperforms the CSI Dividend and the CSI 300, and its performance is similar to that of the All Index Finance.
Looking at the information dividend, according to today’s results, it is similar to the CSI dividend and the CSI 300, but far outperforms the all-index information.
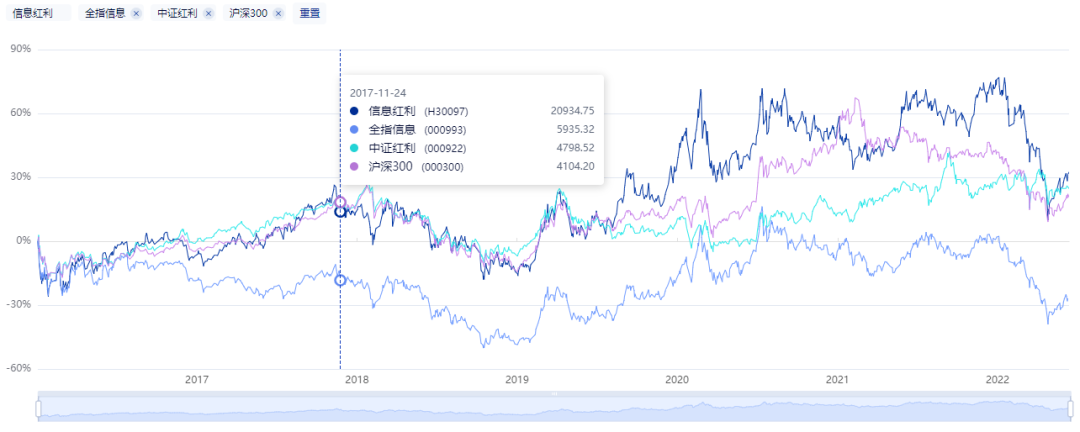
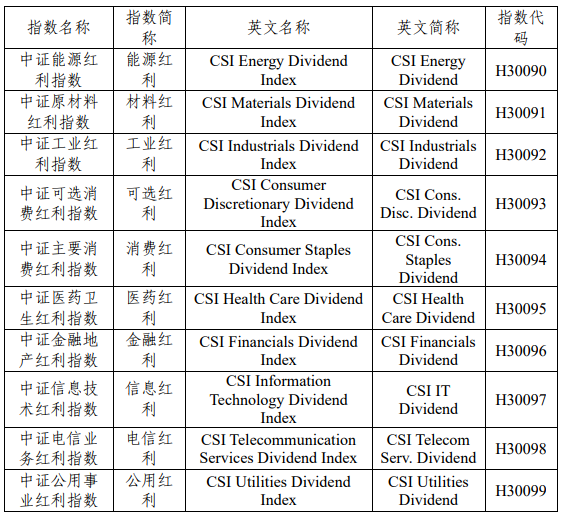
Consumption dividends, optional dividends, financial dividends, and information dividends are all members of the CSI industry dividend index family. The same compilation rules have very different performances, and they are more related to the overall rise and fall of their industries. The role played is not a major factor in the industry dividend index.
From this point of view, if you hold it for a long time from the perspective of dividends, you may face another extreme. The correct way should be to find the logic that really works and prove it to be effective, and then hold the target for a long time.
in conclusion
1. Among these indices, CSI Dividend and Consumer Dividend are standard dividend indices;
2. SZSE dividends, dividend potential, and dividend quality are all to examine companies that have dividends, but they have different requirements for net profit and profit quality, or the source of dividends. The purpose is to find high-quality companies. , after finding out, they are all weighted according to the free-float market capitalization rules.
3. These companies are all involved in dividends. If the index of the samples is adjusted twice a year, they will face a situation where the samples they hold may need to be transferred out within one year, such as the replacement rate of samples with high dividend quality and dividend potential. All need to face the problem of 10% dividend tax. These losses caused by short-term holding due to sample replacement will be paid by fund holders.
4. SZSE dividends, dividend potential and dividend quality are a kind of logic. In my personal understanding, good companies are relatively stable and rare. According to this understanding, my personal ranking is: SZSE dividends > dividend potential > dividend quality. The CSI dividend is another operating logic, and I haven’t figured out how to compare it yet. Consumption dividends, as the same compilation rules as CSI dividends, do well not because of the weighting of the dividend factor and dividend rate, but because of the good development of the main consumption itself.
There are 2 discussions on this topic in Snowball, click to view.
Snowball is an investor’s social network, and smart investors are here.
Click to download Snowball mobile client http://xueqiu.com/xz ]]>
This article is reproduced from: http://xueqiu.com/7588195049/222511061
This site is for inclusion only, and the copyright belongs to the original author.