Original link: https://www.luozhiyun.com/archives/680
Please declare the source for reprinting~, this article was published on luozhiyun’s blog: https://www.luozhiyun.com/archives/680
This article was originally intended to talk about Go Memory Ballast and Go GC Tuner to adjust the GC strategy, how the implementation principle is, and what is the effect. But in the process of writing, I found that Go 1.19 version is out, and there is a new feature that makes these two optimizations a thing of the past.
Overview
First of all, let’s take a brief look at what is done in Go GC, and what is the time-consuming part of it, so that we can optimize it.
First of all, there are several stages for GC:
- Sweep termination: STW will be triggered, all P (processors) will enter the safe-point (safe point);
- the mark phase: to resume program execution, the GC executes the mark of the root node, which includes scanning all stacks, global objects, and runtime data structures that are not in the heap;
- mark termination: trigger STW, reverse GC state, close GC worker threads, etc.;
- the sweep phase: resumes program execution and concurrently cleans up all memory management units in the background;
In these stages, since the marking stage is to traverse the heap from the root node and color and mark the surviving objects, the marking time is related to the currently surviving objects, not the size of the heap, that is, the heap Garbage objects on the GC do not increase the mark time of the GC.
And freeing memory is a very fast operation for modern operating systems, so Go’s GC time is largely determined by the mark phase, not the cleanup phase.
When will the GC be triggered?
I talked about it in detail in this article https://www.luozhiyun.com/archives/475 when I did source code analysis, I will briefly talk about it here.
There are three main places where GC is triggered in Go:
1. Monitor the timing call of thread runtime.sysmon;
2. Manually call the runtime.GC function for garbage collection;
3. When applying for memory, runtime.mallocgc will judge whether to call according to the heap size;
runtime.sysmon
When the Go program starts, a thread will run in the background to execute the runtime.sysmon function regularly. This function is mainly used to check deadlocks, run timers, schedule preemption, and GC.
It will execute the test function in runtime.gcTrigger to determine whether GC should be performed. Since GC may take a long time to execute, the runtime will start a Goroutine in the background to force garbage collection to execute the forcegchelper function when the application starts.
However, the forcegchelper function will always be suspended by the goparkunlock function under normal circumstances. Until sysmon triggers the GC check to pass, the suspended Goroutine will be turned around to the global scheduling queue to wait for the GC to be scheduled.
runtime.GC
This is relatively simple, it will get the current number of GC cycles, and then set the value to gcTriggerCycle mode to call gcStart to cycle.
runtime.mallocgc
As I mentioned in the section on memory allocation https://www.luozhiyun.com/archives/434 , when objects are allocated memory, they will be divided into three categories: micro objects, small objects and large objects according to their size. Tiny malloc, small alloc, large alloc.
Go’s memory allocation adopts pooling technology. Similar to the design of CPU, it is divided into three levels of caches, namely: separate cache pool mcache for each thread, central cache mcentral, and heap page mheap.
Tiny malloc and small alloc will first go to mcache to find free memory blocks for memory allocation. If the memory cannot be allocated in mcache, it will go to mcentral or mheap to apply for memory. At this time, they will try to trigger GC; and for large alloc, it must be Will try to trigger a GC because it allocates memory directly on heap pages.
How to control whether GC should be performed?
The above three places that trigger the GC will eventually call runtime.gcTrigger to execute the GC, but before executing the GC, it must be judged whether the call should be executed or not. Not every call will necessarily execute the GC. The test function in runtime.gcTrigger , this function is responsible for verifying whether this GC should be executed.
The test function in runtime.gcTrigger will finally determine whether GC should be executed according to its own three strategies:
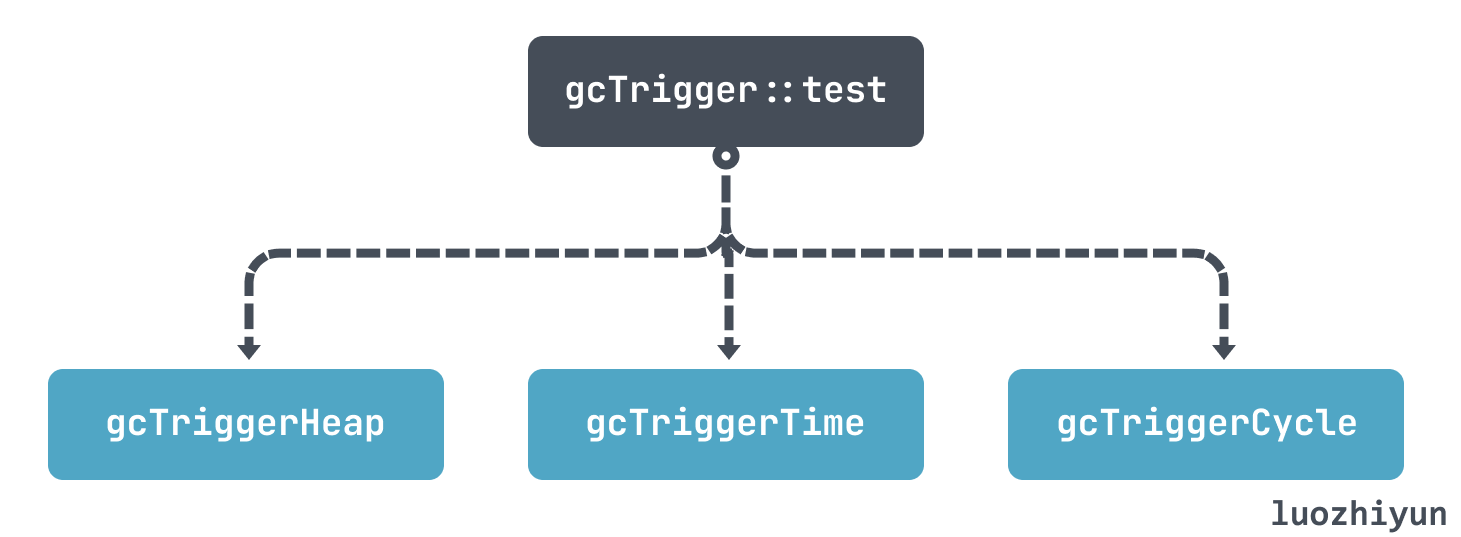
- gcTriggerHeap: Triggered by heap size, when the heap size reaches a certain threshold compared with the last GC;
- gcTriggerTime: Triggered by time, if more than forcegcperiod (default 2 minutes) time is not GC, then GC will be executed;
- gcTriggerCycle: If garbage collection is not turned on, a new cycle is triggered;
If it is the gcTriggerHeap strategy, then it will be judged whether to perform GC according to the value calculated in the runtime.gcSetTriggerRatio function. The environment variable GOGC (the default value is 100) determines the threshold.
We can roughly think that the timing of triggering GC is determined by the size of the heap memory in the last GC and the growth rate of the current heap memory size value. This growth rate is the environment variable GOGC, which is 100 by default. The calculation formula can be roughly understood as:
hard_target = live_dataset + live_dataset * (GOGC / 100).
Assuming that the current memory usage is 100M, then according to the above formula, the GC will not be triggered until 200M.
The timing of triggering GC is not only determined by a single variable of GOGC. In the code runtime.gcSetTriggerRatio , we can see that it controls a range:
func gcSetTriggerRatio(triggerRatio float64) { // gcpercent 由环境变量GOGC 决定if gcpercent >= 0 { // 默认是1 scalingFactor := float64(gcpercent) / 100 // 最大的maxTriggerRatio 是0.95 maxTriggerRatio := 0.95 * scalingFactor if triggerRatio > maxTriggerRatio { triggerRatio = maxTriggerRatio } // 最大的minTriggerRatio 是0.6 minTriggerRatio := 0.6 * scalingFactor if triggerRatio < minTriggerRatio { triggerRatio = minTriggerRatio } } else if triggerRatio < 0 { triggerRatio = 0 } memstats.triggerRatio = triggerRatio trigger := ^uint64(0) if gcpercent >= 0 { // 当前标记存活的大小乘以1+系数triggerRatio trigger = uint64(float64(memstats.heap_marked) * (1 + triggerRatio)) ... } memstats.gc_trigger = trigger ... }
The specific threshold calculation is more complicated. From the gcControllerState.endCycle function, you can see that the timing of executing GC depends on the following factors:
- The current CPU usage and the GC marking phase cannot exceed 25% of the entire application;
- Auxiliary GC marks the object CPU usage;
- Target growth rate (estimated), the value is equal to: (heap size after the next GC – heap survival size) / heap survival size;
- The actual growth rate of the heap: total heap size/survival size after the last mark -1;
- The size of the heap growth rate triggered by the last GC;
A value obtained after the calculation of these comprehensive factors is the size of the current GC heap growth rate. These can be printed out by GODEBUG=gctrace=1,gcpacertrace=1 .
Let’s look at a concrete example:
package main import ( "fmt" ) func allocate() { _ = make([]byte, 1<<20) } func main() { fmt.Println("start.") fmt.Println("> loop.") for { allocate() } fmt.Println("< loop.") }
Use gctrace to trace the GC situation:
[root@localhost gotest]# go build main.go [root@localhost gotest]# GODEBUG=gctrace=1 ./main start. > loop. ... gc 1409 @0.706s 14%: 0.009+0.22+0.076 ms clock, 0.15+0.060/0.053/0.033+1.2 ms cpu, 4->6->2 MB, 5 MB goal, 16 P gc 1410 @0.706s 14%: 0.007+0.26+0.092 ms clock, 0.12+0.050/0.070/0.030+1.4 ms cpu, 4->7->3 MB, 5 MB goal, 16 P gc 1411 @0.707s 14%: 0.007+0.36+0.059 ms clock, 0.12+0.047/0.092/0.017+0.94 ms cpu, 5->7->2 MB, 6 MB goal, 16 P ... < loop.
The above shows the situation of 3 GCs, let’s take a look:
gc 1410 @0.706s 14%: 0.007+0.26+0.092 ms clock, 0.12+0.050/0.070/0.030+1.4 ms cpu, 4->7->3 MB, 5 MB goal, 16 P内存4 MB:标记开始前堆占用大小(in-use before the Marking started) 7 MB:标记结束后堆占用大小(in-use after the Marking finished) 3 MB:标记完成后存活堆的大小(marked as live after the Marking finished) 5 MB goal:标记完成后正在使用的堆内存的目标大小(Collection goal)
It can be seen that the heap size after the end of the mark is 7 MB, but the estimated target value given is 5 MB. You can see that the collector exceeds the target set by it by 2 MB, so its target value is also inaccurate. of.
In 1410 GCs, the heap size after the last mark is 3 MB, so we can roughly guess according to GOGC that the heap size should not exceed 6MB in the next GC, so we can look at 1411 GCs:
gc 1411 @0.707s 14%: 0.007+0.36+0.059 ms clock, 0.12+0.047/0.092/0.017+0.94 ms cpu, 5->7->2 MB, 6 MB goal, 16 P内存5 MB:标记开始前堆占用大小(in-use before the Marking started) 7 MB:标记结束后堆占用大小(in-use after the Marking finished) 2 MB:标记完成后存活堆的大小(marked as live after the Marking finished) 6 MB goal:标记完成后正在使用的堆内存的目标大小(Collection goal)
It can be seen that at 1411 GC starts the heap size is 5 MB which is under control.
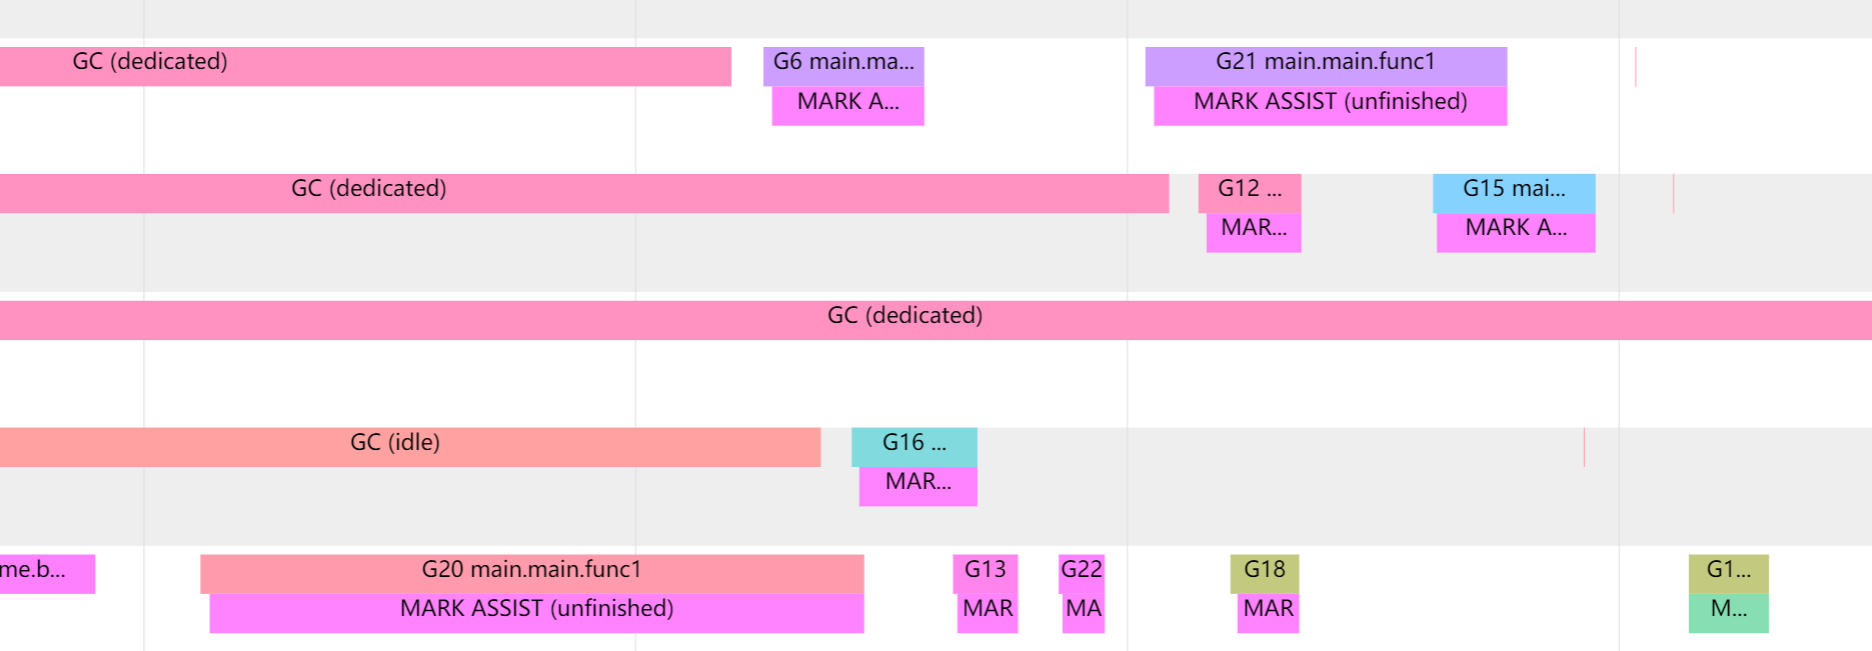
Having said so many GC mechanisms, is it possible that the speed of GC cannot keep up with the speed of garbage creation? This leads to another mechanism in GC: Mark assist.
If the collector determines that it needs to slow down allocations, it will recruit application goroutines to assist with the marking work. This is called Mark assist. This is why it is necessary to judge whether to execute mallocgc for GC when allocating memory.
When performing Mark assist, Goroutines will suspend the current work and perform auxiliary mark work, which will cause some delay in the task of the current Goroutines work.
And our GC will also eliminate Mark assist as much as possible, so the next GC time will be earlier, and the GC will be triggered more frequently.
We can observe the situation of Mark assist through go tool trace:
Go Memory Ballast
After we are familiar with the Go GC strategy above, let’s take a look at how Go Memory Ballast optimizes GC. Let’s take a look at an example:
func allocate() { _ = make([]byte, 1<<20) } func main() { ballast := make([]byte, 200*1024*1024) // 200M for i := 0; i < 10; i++ { go func() { fmt.Println("start.") fmt.Println("> loop.") for { allocate() } fmt.Println("< loop.") }() } runtime.KeepAlive(ballast)
We run the above code snippet, and then we perform simple statistics on resource utilization:
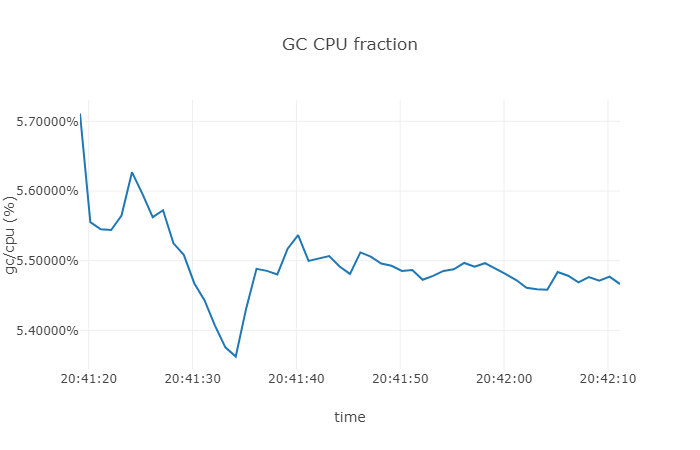
From the above results we can see that the CPU utilization of the GC is around 5.5%.
Let’s remove the memory footprint of ballast to see how much it will be:
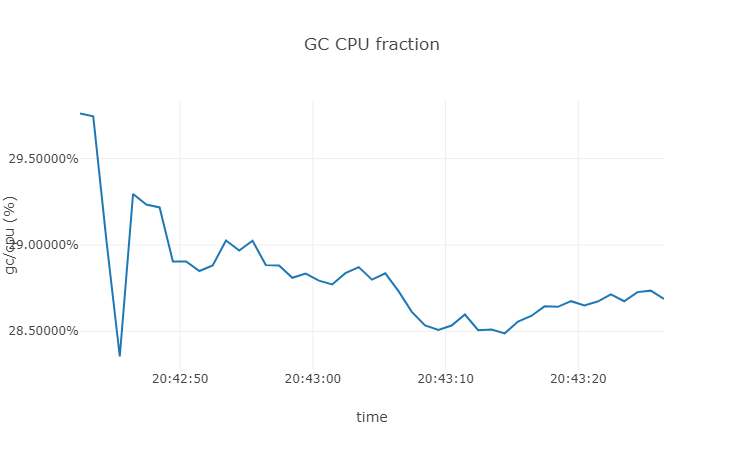
It can be seen that the CPU usage of GC is about 28% when there is no ballast. Friends who are interested in other GC information can use runtime.Memstats to regularly capture GC information for printing.
So why is the CPU usage so much lower after applying for an empty array? First of all, as we mentioned in the overview, the GC will determine the execution timing of the next GC according to the environment variable GOGC, so if we apply for an array of 200M, the next GC will be about 400M. Since in our example above, the objects applied by the allocate function are all temporary objects, which will be reduced to about 200M again after the GC, so the next time the GC is executed, it will be set to 400M again.
However, if there is no ballast array, you can test it yourself if you are interested. GC will be triggered at about 4M, which will undoubtedly cause quite frequent GC for systems with many temporary variables.
In short, by setting the ballast array, we achieve the effect of delaying GC, but this effect is only useful in systems with many temporary variables, and is not very useful for systems with many global variables.
Then there is another question. Will applying for a memory as large as 200M for no reason in the system cause a waste of memory? After all, memory is so expensive. In fact, don’t worry, as long as we don’t read and write the ballast array, we won’t really use the physical memory footprint. We can take a look at the following example:
func main() { _ = make([]byte, 100<<20) <-time.After(time.Duration(math.MaxInt64)) } $ ps -eo pmem,comm,pid,maj_flt,min_flt,rss,vsz --sort -rss | numfmt --header --to=iec --field 4-5 | numfmt --header --from-unit=1024 --to=iec --field 6-7 | column -t | egrep "[t]est|[P]ID" %MEM COMMAND PID MAJFL MINFL RSS VSZ 0.0 test_alloc 31248 0 1.1K 7.4M 821M
It can be seen that the virtual memory VSZ occupies a large amount, but the memory size allocated by the RSS process is small.
func main() { ballast := make([]byte, 100<<20) for i := 0; i < len(ballast)/2; i++ { ballast[i] = byte('A') } <-time.After(time.Duration(math.MaxInt64)) } $ ps -eo pmem,comm,pid,maj_flt,min_flt,rss,vsz --sort -rss | numfmt --header --to=iec --field 4-5 | numfmt --header --from-unit=1024 --to=iec --field 6-7 | column -t | egrep "[t]est|[P]ID" %MEM COMMAND PID MAJFL MINFL RSS VSZ 0.4 test_alloc 31692 0 774 60M 821M
But if we want to write to it, the memory size allocated by the RSS process will become larger, and the rest can be verified by ourselves.
The discussion on Go Ballast actually mentioned an issue a long time ago. In fact, the official only needs to add a parameter of the minimum heap size, but it has not been implemented. In contrast, Java has many GC tuning parameters, and InitialHeapSize can set the initial value of the heap.
This has also led to many projects with high performance requirements, such as: tidb , cortex have added such an empty array implementation in the code.
Go GC Tuner
This method is actually introduced in this article from uber . The fundamental problem is that Go’s GC is too frequent, which causes the mark to occupy a high CPU, but Go also provides GOGC to adjust the timing of GC, so is there a way to dynamically adjust the value of GOGC according to the current memory? How to control the frequency of GC?
In fact, the runtime.SetFinalizer function is provided in Go, which will call back when the object is GC. In Go it is defined like this:
type any = interface{} func SetFinalizer(obj any, finalizer any)
obj is generally a pointer to an object; a finalizer is a function that accepts a single parameter that can be directly assigned a value of type obj. That is to say, the role of SetFinalizer is to set the destructor of the obj object as finalizer. When the garbage collector finds that obj cannot be accessed directly or indirectly, it will clean up obj and call finalizer.
So we can use it to set a hook, check the memory situation after each GC, and then set the GOGC value:
type finalizer struct { ref *finalizerRef } type finalizerRef struct { parent *finalizer } func finalizerHandler(f *finalizerRef) { // 为GOGC 动态设值getCurrentPercentAndChangeGOGC() // 重新设置回去,否则会被真的清理runtime.SetFinalizer(f, finalizerHandler) } func NewTuner(options ...OptFunc) *finalizer { // 处理传入的参数... f := &finalizer{} f.ref = &finalizerRef{parent: f} runtime.SetFinalizer(f.ref, finalizerHandler) // 设置为nil,让GC 认为原f.ref 函数是垃圾,以便触发finalizerHandler 调用f.ref = nil return f }
The above code takes advantage of the finalizer feature. During GC, getCurrentPercentAndChangeGOGC will be called to reset the GOGC value. Since the finalizer will extend the life cycle of the object, we can call SetFinalizer again after setting the GOGC in the finalizerHandler to rebind the object. Set on Finalizer.
This constitutes a cycle, each GC will have a finalizerRef object to dynamically change the GOGC value according to the current memory situation, so as to achieve the purpose of adjusting the number of GCs and saving resources.
As we mentioned above, GC basically calculates the timing of the next GC based on the heap size after this GC:
hard_target = live_dataset + live_dataset * (GOGC / 100).
For example, after this GC, the heap size live_dataset is 100M. For the default value of 100 for GOGC, GC will be triggered when the heap size is 200M.
In order to maximize the use of memory and reduce the number of GCs, then we can set GOGC to:
(可使用内存最大百分比- 当前占内存百分比)/当前占内存百分比* 100
That is to say, if there is a machine, all the memory is used by our application, and the application currently occupies 10%, which is 100M, then:
GOGC = (100%-10%)/10% * 100 = 900Then according to the above hard_target calculation formula, it can be known that the application will start GC when the heap occupation reaches 1G. Of course, it is impossible to be so limited in our production, and the specific maximum percentage of the maximum usable memory needs to be adjusted according to the current situation.
Then converted into code, our getCurrentPercentAndChangeGOGC can be written like this:
var memoryLimitInPercent float64 = 100 func getCurrentPercentAndChangeGOGC() { p, _ := process.NewProcess(int32(os.Getpid())) // 获取当前应用占用百分比memPercent, _ := p.MemoryPercent() // 计算GOGC 值newgogc := (memoryLimitInPercent - float64(memPercent)) / memPercent * 100.0 // 设置GOGC 值debug.SetGCPercent(int(newgogc)) }
In the above code, I omitted a lot of exception handling, default handling, and memoryLimitInPercent was written as a fixed value. When it is actually used, the code needs to be improved.
Written here, the above Go Memory Ballast and Go GC Tuner have achieved our optimization purpose, but when I was about to submit the draft, Cao Chunhui posted an article , talking about the latest Go version 1.19 beta1 version Added a new debug.SetMemoryLimit function.
Soft Memory Limit
This optimization comes from issue #48409 , which was added in Go 1.19 version. The optimization principle is actually similar to the above. Through the built-in debug.SetMemoryLimit function, we can adjust the target value of heap memory that triggers GC, thereby reducing the number of GCs and reducing the time of GC. The purpose of CPU usage.
We also mentioned above that Go implements three strategies to trigger GC, one of which is gcTriggerHeap, which sets the heap target value for the next GC execution according to the size of the heap. Version 1.19 of the code is a modification of the gcTriggerHeap strategy.
Through the code call we can know the gcControllerState。heapGoalInternal calculates HeapGoal, two methods are used, one is to calculate by GOGC value, the other is to calculate by memoryLimit value, and then take the smaller value of the two as HeapGoal.
func (c *gcControllerState) heapGoalInternal() (goal, minTrigger uint64) { // Start with the goal calculated for gcPercent. goal = c.gcPercentHeapGoal.Load() //通过GOGC 计算heapGoal // 通过memoryLimit 计算heapGoal,并和goal 比较大小,取小的if newGoal := c.memoryLimitHeapGoal(); go119MemoryLimitSupport && newGoal < goal { goal = newGoal } else { ... } return }
gcPercentHeapGoal is calculated as follows:
func (c *gcControllerState) commit(isSweepDone bool) { ... gcPercentHeapGoal := ^uint64(0) if gcPercent := c.gcPercent.Load(); gcPercent >= 0 { // HeapGoal = 存活堆大小+ (存活堆大小+栈大小+全局变量大小)* GOGC/100 gcPercentHeapGoal = c.heapMarked + (c.heapMarked+atomic.Load64(&c.lastStackScan)+atomic.Load64(&c.globalsScan))*uint64(gcPercent)/100 } c.gcPercentHeapGoal.Store(gcPercentHeapGoal) ... }
It is not much different from the hard_target calculation we mentioned above, which can be understood as:
HeapGoal = live_dataset + (live_dataset+栈大小+全局变量大小)* GOGC/100
Let’s look at the memoryLimitHeapGoal calculation again:
func (c *gcControllerState) memoryLimitHeapGoal() uint64 { var heapFree, heapAlloc, mappedReady uint64 heapFree = c.heapFree.load() heapAlloc = c.totalAlloc.Load() - c.totalFree.Load() mappedReady = c.mappedReady.Load() memoryLimit := uint64(c.memoryLimit.Load()) nonHeapMemory := mappedReady - heapFree - heapAlloc ... goal := memoryLimit - nonHeapMemory ... return goal }
The above code can basically be understood as:
goal = memoryLimit - 非堆内存
So just because the trigger of Go GC is to take the smaller value of the above two calculation results, then we used GOGC to fill too much in fear of causing OOM, now we can add the memoryLimit parameter to limit it; or directly GOGC = off, and then set The memoryLimit parameter, through which to deploy our GC.
Summarize
In this article, we mainly explain the trigger mechanism of Go GC, and then introduce the use of this mechanism to reduce the number of GCs in a hacker way, thereby reducing GC consumption.
Go Memory Ballast mainly presets a large array to allow Go to increase the heap memory threshold for the next time Go triggers GC when it starts, so as to avoid unnecessary memory caused by continuous GC when there are many temporary variables in the application. consumption.
Go GC Tuner mainly uses the GC hook provided by Go to set Finalizer to dynamically set GOGC according to the current memory usage after GC, so as to achieve the purpose of reducing GC.
Soft Memory Limit is a new feature of version 1.19. It realizes GC control through a built-in method. By setting memoryLimit to control the GC memory trigger threshold, the purpose of reducing GC is achieved. The principle is actually not fundamentally different from the above two methods. In the link, the current non-heap memory usage can be checked more precisely, so as to achieve more precise control.
Reference
https://github.com/golang/go/issues/23044
https://www.cnblogs.com/457220157-FTD/p/15567442.html
https://github.com/golang/go/issues/42430
https://eng.uber.com/how-we-saved-70k-cores-across-30-mission-critical-services/
https://xargin.com/dynamic-gogc/
https://github.com/cch123/gogctuner
https://golang.design/under-the-hood/en-us/part2runtime/ch08gc/pacing/
https://medium.com/a-journey-with-go/go-finalizers-786df8e17687
https://draveness.me/golang/docs/part3-runtime/ch07-memory/golang-garbage-collector
https://xargin.com/the-new-api-for-heap-limit/
https://pkg.go.dev/runtime/debug@master#SetMemoryLimit
https://tip.golang.org/doc/go1.19
https://github.com/golang/go/issues/48409

The first post about two Go GC optimization strategies that are about to become obsolete appeared on luozhiyun`s Blog .
This article is reproduced from: https://www.luozhiyun.com/archives/680
This site is for inclusion only, and the copyright belongs to the original author.